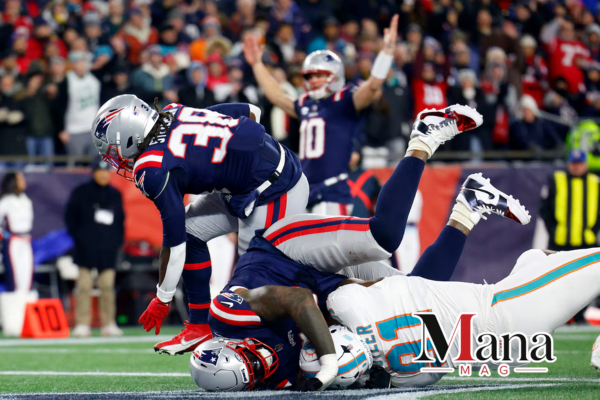
The New England Patriots defeated the Miami Dolphins 38-10 on January 4, 2026, at Gillette Stadium in Foxborough. The Patriots finished the regular season 14-3 and secured the No. 2 seed in the AFC, while Miami ended the season 7-10.
The Miami Dolphins vs New England Patriots match player stats show why the final score became so one-sided. New England gained 457 total yards compared with Miami’s 180. The Patriots ran for 243 yards, while the Dolphins managed only 63. New England also produced four rushing touchdowns and held Miami scoreless in the second half.
Drake Maye completed 14 of 18 passes for 191 yards, one touchdown and no interceptions. Rhamondre Stevenson delivered the biggest individual rushing performance with 131 yards and two rushing touchdowns on only seven carries. TreVeyon Henderson added 53 rushing yards and two touchdowns.
For Miami, Quinn Ewers completed 16 of 23 passes for 137 yards, one touchdown and one interception. Jaylen Wright led the Dolphins in rushing with 23 yards on 13 carries, while Theo Wease Jr. led Miami in receiving yards with 44.
Miami Dolphins vs New England Patriots Final Score
| Team | 1st Quarter | 2nd Quarter | 3rd Quarter | 4th Quarter | Final |
| Miami Dolphins | 0 | 10 | 0 | 0 | 10 |
| New England Patriots | 14 | 3 | 14 | 7 | 38 |
The Patriots started fast, taking a 14-0 lead in the opening quarter.
Miami responded with 10 points in the second quarter and briefly made the game competitive. New England led 17-10 at halftime.
The second half belonged entirely to the Patriots. New England scored 14 points in the third quarter and another seven in the fourth. Miami did not score after halftime.
Key Miami Dolphins vs New England Patriots Player Stats
| Player | Team | Key Stat Line |
| Drake Maye | Patriots | 14/18, 191 yards, 1 TD, 0 INT |
| Rhamondre Stevenson | Patriots | 7 carries, 131 yards, 2 rush TDs |
| TreVeyon Henderson | Patriots | 13 carries, 53 yards, 2 rush TDs |
| Hunter Henry | Patriots | 5 receptions, 56 yards |
| Quinn Ewers | Dolphins | 16/23, 137 yards, 1 TD, 1 INT |
| Jaylen Wright | Dolphins | 13 carries, 23 yards |
| Theo Wease Jr. | Dolphins | 3 receptions, 44 yards |
| Malik Washington | Dolphins | 3 receptions, 6 yards, 1 TD |
The Patriots received strong production from their quarterback, running backs and passing game. Miami had individual contributors, but the Dolphins could not generate enough offensive production to stay with New England.
Drake Maye Delivered an Efficient Quarterback Performance
Drake Maye passing stats
Drake Maye finished the game with:
| Statistic | Drake Maye |
| Completions | 14 |
| Attempts | 18 |
| Completion Rate | 77.8% |
| Passing Yards | 191 |
| Yards per Attempt | 10.6 |
| Touchdowns | 1 |
| Interceptions | 0 |
| Sacks | 0 |
| Passer Rating | 129.4 |
Maye did not need a huge passing workload because New England’s running game was producing big gains.
He completed 14 of 18 attempts and averaged 10.6 yards per attempt. That combination gave the Patriots efficient passing production without requiring Maye to throw the ball repeatedly.
He also avoided an interception and was not sacked. That helped New England maintain possession and avoid the negative plays that affected Miami.
Maye also contributed as a runner
Maye added 41 rushing yards on five carries, averaging 8.2 yards per attempt.
That rushing production gave Miami another problem to account for. The Patriots could attack with their running backs while Maye remained a threat to gain yardage when the pocket opened.
Maye’s performance also capped a strong regular season. New England finished 14-3 and entered the playoffs as the AFC’s No. 2 seed.
Quinn Ewers Led Miami’s Passing Attack
Quinn Ewers passing stats
Quinn Ewers finished with:
| Statistic | Quinn Ewers |
| Completions | 16 |
| Attempts | 23 |
| Completion Rate | 69.6% |
| Passing Yards | 137 |
| Yards per Attempt | 6.0 |
| Touchdowns | 1 |
| Interceptions | 1 |
| Sacks | 4 |
| Sack Yards Lost | 20 |
| Passer Rating | 81.2 |
Ewers completed nearly 70% of his passes, but Miami’s passing attack lacked the yardage efficiency needed to keep pace.
He averaged only 6.0 yards per attempt and threw one interception. The four sacks also created additional problems for the Dolphins.
New England’s defense pressured Miami more effectively than Miami pressured Maye. That difference became especially important as the Patriots built their second-half lead.
Zach Wilson saw limited action
Zach Wilson attempted two passes but completed neither.
He finished with zero passing yards and a 39.6 passer rating. His limited workload came late in the game after the Patriots had established a commanding lead.
Rhamondre Stevenson Was the Game’s Biggest Offensive Standout
Stevenson dominated on the ground
Rhamondre Stevenson produced one of the most efficient performances in the game.
| Statistic | Rhamondre Stevenson |
| Carries | 7 |
| Rushing Yards | 131 |
| Average | 18.7 yards |
| Rushing TDs | 2 |
| Longest Run | 56 yards |
| Receiving TDs | 1 |
Stevenson needed only seven carries to reach 131 rushing yards.
His 56-yard run was the longest rushing play of the game. He also scored twice on the ground and caught a 15-yard touchdown pass from Maye. That gave him three total touchdowns.
His performance changed the shape of the game. Miami could not consistently stop the Patriots’ rushing attack, which forced the Dolphins to defend a large number of favorable down-and-distance situations.
TreVeyon Henderson Added Two Rushing Touchdowns
Henderson finished with 53 rushing yards on 13 carries.
| Statistic | TreVeyon Henderson |
| Carries | 13 |
| Rushing Yards | 53 |
| Average | 4.1 yards |
| Rushing TDs | 2 |
| Longest Run | 13 yards |
Henderson scored New England’s opening touchdown on a five-yard run and later added another two-yard touchdown in the fourth quarter.
His production complemented Stevenson’s explosive rushing numbers. Stevenson supplied the big gains, while Henderson handled a larger share of the rushing workload.
Jaylen Wright Struggled to Establish Miami’s Running Game
Jaylen Wright was Miami’s leading rusher by attempts.
| Statistic | Jaylen Wright |
| Carries | 13 |
| Rushing Yards | 23 |
| Average | 1.8 yards |
| Rushing TDs | 0 |
| Longest Run | 7 yards |
The 13 carries were tied with Henderson for the most by an individual running back in the game, but the results were very different.
Wright averaged only 1.8 yards per carry.
Miami finished with 63 rushing yards on 25 attempts. New England produced 243 yards on 34 attempts. The 180-yard difference was the clearest statistical gap in the matchup.
Miami’s Other Rushing Numbers
Malik Washington gave Miami a few explosive runs.
He carried the ball twice for 22 yards, averaging 11 yards per attempt. His longest run went for 14 yards.
Ollie Gordon II had nine carries for nine yards, while Ewers added nine yards on one rushing attempt.
The Dolphins finished with no rushing touchdowns.
| Dolphins Rusher | Carries | Yards | Average | TD |
| Jaylen Wright | 13 | 23 | 1.8 | 0 |
| Malik Washington | 2 | 22 | 11.0 | 0 |
| Quinn Ewers | 1 | 9 | 9.0 | 0 |
| Ollie Gordon II | 9 | 9 | 1.0 | 0 |
| Team Total | 25 | 63 | 2.5 | 0 |
The lack of rushing production put more pressure on Ewers and the passing game.
Hunter Henry Led the Patriots in Receiving
Hunter Henry finished as New England’s leading receiver.
| Statistic | Hunter Henry |
| Receptions | 5 |
| Targets | 5 |
| Receiving Yards | 56 |
| Average | 11.2 yards |
| Touchdowns | 0 |
| Long Reception | 29 yards |
Henry caught all five passes thrown his way and produced 56 yards.
Stefon Diggs added 43 yards on three receptions, while Efton Chism III recorded a 35-yard reception.
New England finished with 17 receptions for 214 passing yards.
The Patriots did not need one receiver to dominate the game because their running attack created favorable conditions for the passing game.
Miami Dolphins Receiving Stats
Theo Wease Jr. led Miami in receiving yards.
| Dolphins Receiver | Receptions | Yards | Average | TD |
| Theo Wease Jr. | 3 | 44 | 14.7 | 0 |
| Greg Dulcich | 3 | 31 | 10.3 | 0 |
| Tahj Washington | 2 | 26 | 13.0 | 0 |
| Jaylen Wright | 2 | 17 | 8.5 | 0 |
| Julian Hill | 1 | 8 | 8.0 | 0 |
| Malik Washington | 3 | 6 | 2.0 | 1 |
| Alec Ingold | 1 | 3 | 3.0 | 0 |
| Ollie Gordon II | 1 | 2 | 2.0 | 0 |
Malik Washington scored Miami’s only receiving touchdown on a two-yard pass from Ewers.
Wease Jr. was the team’s top receiver by yardage with 44 yards. Greg Dulcich followed with 31 yards.
The Team Statistics Explain the 38-10 Score
The individual player numbers become clearer when placed beside the team totals.
| Category | Dolphins | Patriots |
| First Downs | 13 | 22 |
| Rushing Yards | 63 | 243 |
| Passing Yards | 117 | 214 |
| Total Yards | 180 | 457 |
| Rushing Attempts | 25 | 34 |
| Passing Attempts | 25 | 22 |
| Yards per Rush | 2.5 | 7.1 |
| Yards per Pass Attempt | 5.5 | 9.7 |
| Sacks Allowed | 4 | 0 |
| Interceptions Thrown | 1 | 0 |
| Third Down | 5/13 | 5/10 |
| Time of Possession | 29:11 | 30:49 |
| Turnovers | 2 | 0 |
New England gained 277 more total yards than Miami.
The Patriots also produced 22 first downs compared with 13 for the Dolphins.
One of the most telling numbers was the difference in average gain per offensive play. New England averaged 8.2 yards per play, while Miami averaged only 3.3.
New England Won the Battle on the Ground
The Patriots rushed for 243 yards on 34 attempts.
Miami rushed for 63 yards on 25 attempts.
That difference produced a 180-yard advantage for New England.
The Patriots averaged 7.1 yards per rushing attempt. Miami averaged only 2.5.
New England also scored four rushing touchdowns. Miami scored none.
This allowed the Patriots to control the game without forcing Maye to throw a large number of passes.
The Passing Efficiency Gap Was Also Large
New England attempted 22 passes and gained 214 net passing yards.
Miami attempted 25 passes and gained 117 net passing yards.
The Patriots averaged 9.7 yards per pass attempt. Miami averaged 5.5.
Maye’s individual 10.6 yards per attempt was especially strong. Ewers averaged 6.0.
The Dolphins completed more passes, 16 compared with New England’s 17, but the Patriots gained far more yardage from those completions.
New England’s Defense Created More Negative Plays
The Patriots recorded four sacks while Miami recorded none.
That is important because Ewers was pressured repeatedly while Maye remained protected.
Miami also struggled to stop New England’s running game before the line of scrimmage. The Patriots’ rushing attack consistently created positive yardage, while the Dolphins had difficulty producing similar gains.
The Patriots finished with 457 total yards and held Miami to 180.
That 277-yard difference reflects the defensive and offensive gap between the teams.
The Second Half Decided the Match
The score at halftime was 17-10.
Miami still had a chance to make the game competitive.
That changed immediately after halftime.
New England scored 14 points in the third quarter and another seven in the fourth. Miami scored zero in both periods.
The Patriots therefore outscored Miami 21-0 after halftime.
New England also gained 230 of its 457 total yards in the second half.
Third-quarter scoring
Rhamondre Stevenson scored on a 15-yard reception from Maye.
Stevenson later added a 35-yard rushing touchdown.
Those two scores pushed New England’s lead from seven points to 21.
Fourth-quarter scoring
Henderson scored on a two-yard rushing touchdown in the fourth quarter.
That gave the Patriots a 38-10 lead and completed the scoring.
Miami’s Turnovers Hurt the Offense
Miami finished with two turnovers.
The Dolphins lost one fumble and threw one interception.
New England committed no turnovers.
The interception came when Jaylinn Hawkins picked off Ewers in the end zone early in the second half. That prevented Miami from turning the possession into points and helped New England maintain control.
Ball security was therefore another area where the Patriots had the edge.
Special Teams Also Favored New England
Riley Patterson made one field goal for Miami, including a 52-yard kick.
New England’s Andy Borregales made one of two field-goal attempts and connected from 59 yards.
The Patriots also punted three times compared with six Miami punts.
| Special Teams Category | Dolphins | Patriots |
| Punts | 6 | 3 |
| Punt Average | 40.8 | 51.7 |
| Field Goals | 1/1 | 1/2 |
| Kick Returns | 2 for 54 | 2 for 51 |
| Punt Returns | 1 for 2 | 0 |
Miami’s six punts were twice New England’s total.
That does not automatically determine a game, but here the figure matches the broader offensive story. The Patriots sustained more productive drives, while Miami struggled to maintain momentum.
Why the Patriots Won
New England produced explosive rushing plays
Stevenson averaged 18.7 yards per carry and recorded a 56-yard run.
That single statistic shows how much more explosive New England was on the ground.
Miami’s longest rush was only 14 yards.
The Patriots kept Maye protected
Maye was not sacked.
Ewers was sacked four times for 20 yards lost.
The difference gave Maye more opportunities to operate within the offense and forced Miami into more difficult situations.
New England converted opportunities into touchdowns
The Patriots scored five touchdowns.
Four came on rushing plays, and one came through the air.
Miami scored one touchdown through the air and added a field goal.
The difference in touchdown production explains much of the 28-point final margin.
Miami could not sustain its running game
Wright carried 13 times for only 23 yards.
Gordon had nine carries for nine yards.
As a team, Miami averaged 2.5 yards per rushing attempt.
That made the Dolphins one-dimensional for much of the afternoon.
What the Dolphins vs Patriots Stats Reveal
The final score alone suggests a dominant Patriots victory. The underlying statistics show how that dominance developed.
New England was better in almost every major offensive measure.
The Patriots had:
- 22 first downs.
- 457 total yards.
- 243 rushing yards.
- 214 passing yards.
- 7.1 yards per rushing attempt.
- 9.7 yards per pass attempt.
- Five touchdowns.
- Zero turnovers.
Miami had:
- 13 first downs.
- 180 total yards.
- 63 rushing yards.
- 117 passing yards.
- 2.5 yards per rushing attempt.
- 5.5 yards per pass attempt.
- One touchdown and one field goal.
- Two turnovers.
The Patriots did not rely on one part of the offense. They ran effectively, passed efficiently, protected the quarterback and finished drives with touchdowns.
Player Performance Comparison
| Category | Dolphins Leader | Patriots Leader |
| Passing Yards | Quinn Ewers, 137 | Drake Maye, 191 |
| Rushing Yards | Jaylen Wright, 23 | Rhamondre Stevenson, 131 |
| Receiving Yards | Theo Wease Jr., 44 | Hunter Henry, 56 |
| Passing TDs | Quinn Ewers, 1 | Drake Maye, 1 |
| Rushing TDs | None | Stevenson and Henderson, 4 combined |
| Total Offensive Impact | Ewers | Stevenson |
The biggest difference was the rushing category.
Ewers and Maye both threw one touchdown pass, but the Patriots’ running backs produced four rushing touchdowns.
Stevenson alone gained 131 rushing yards. Miami’s entire rushing attack gained 63.
That contrast explains why the Patriots could win comfortably without asking Maye to throw more than 18 passes.
A Note About Miami’s Offensive Personnel
Miami entered the game without some of its major offensive weapons.
De’Von Achane and Jaylen Waddle were inactive. Tua Tagovailoa was also inactive, leaving rookie Quinn Ewers to start at quarterback.
That context matters when reading the Dolphins vs Patriots stats.
Miami’s offense still had players capable of producing yards, but the available personnel made the matchup more difficult.
Ewers completed 16 passes and threw a touchdown, but New England’s defense kept the Dolphins from generating enough explosive plays.
Final Takeaway From the Miami Dolphins vs New England Patriots Match Player Stats
The New England Patriots’ 38-10 victory was built around efficiency and physical control.
Drake Maye completed 14 of 18 passes for 191 yards, one touchdown and no interceptions. Rhamondre Stevenson produced 131 rushing yards and three total touchdowns. TreVeyon Henderson added 53 rushing yards and two rushing touchdowns.
For Miami, Quinn Ewers completed 16 of 23 passes for 137 yards and one touchdown, but he also threw an interception and took four sacks. Jaylen Wright managed only 23 rushing yards, and the Dolphins finished with 63 rushing yards as a team.
The team numbers make the difference even clearer. New England produced 457 total yards against Miami’s 180. The Patriots ran for 243 yards, averaged 7.1 yards per carry, committed no turnovers and shut Miami out in the second half.
For readers searching for Miami Dolphins vs New England Patriots match player stats or Dolphins vs Patriots stats, the main takeaway is straightforward. New England won the line of scrimmage, created bigger plays, protected Maye and turned its offensive opportunities into touchdowns.
FAQ
Who won the Miami Dolphins vs New England Patriots game?
The New England Patriots defeated the Miami Dolphins 38-10 on January 4, 2026, at Gillette Stadium in Foxborough.
Who was the best player in the Dolphins vs Patriots game?
Rhamondre Stevenson produced one of the strongest individual performances. He rushed for 131 yards and two touchdowns on seven carries and added a 15-yard receiving touchdown.
How many yards did Drake Maye throw for?
Drake Maye passed for 191 yards on 14 completions from 18 attempts. He threw one touchdown and no interceptions.
How many yards did Quinn Ewers pass for?
Quinn Ewers completed 16 of 23 passes for 137 yards, one touchdown and one interception.
Who led the game in rushing?
Rhamondre Stevenson led all rushers with 131 yards on seven carries. His longest run was 56 yards.
How many rushing yards did the Patriots have?
New England rushed for 243 yards on 34 attempts, averaging 7.1 yards per carry.
How many rushing yards did the Dolphins have?
Miami finished with 63 rushing yards on 25 attempts, averaging 2.5 yards per carry.
Who led the Patriots in receiving?
Hunter Henry led New England with five receptions for 56 yards.
Who led Miami in receiving?
Theo Wease Jr. led the Dolphins with three receptions for 44 yards.
How many touchdowns did Rhamondre Stevenson score?
Stevenson scored three total touchdowns. He scored twice on rushing plays and once on a 15-yard reception from Drake Maye.
How many touchdowns did TreVeyon Henderson score?
Henderson scored two rushing touchdowns. He finished with 53 rushing yards on 13 carries.
How many turnovers did each team have?
Miami had two turnovers, one interception and one lost fumble. New England had zero turnovers.
Which team had more total yards?
New England had 457 total yards, while Miami had 180. The Patriots therefore gained 277 more total yards.
Did Miami score in the second half?
No. Miami scored 10 points in the second quarter but was shut out in both the third and fourth quarters. New England scored 21 points after halftime.
How many sacks did the Patriots record?
New England recorded four sacks of Miami’s quarterbacks. Miami did not record a sack of New England’s quarterbacks.
What was the biggest statistical difference in the game?
Rushing production was the biggest difference. New England gained 243 rushing yards compared with 63 for Miami, a gap of 180 yards. The Patriots also scored four rushing touchdowns while Miami scored none.
What was the final score by quarter?
Miami scored 0, 10, 0 and 0 points across the four quarters. New England scored 14, 3, 14 and 7, finishing with a 38-10 victory.

Must See
-

Sports
/ 2 weeks agoLos Angeles Chargers vs Detroit Lions Match Player Stats: 2025 Hall of Fame Game
The Los Angeles Chargers defeated the Detroit Lions 34-7 in the 2025 NFL Hall...
By Mica -


Sports
/ 2 weeks agoPittsburgh Pirates vs Mets Match Player Stats: August 2026 Game Breakdown
The Pittsburgh Pirates and New York Mets produced two very different games during their...
By Mica -


Sports
/ 2 weeks agoGolden State Warriors vs Orlando Magic Match Player Stats, Box Score and Game Analysis
The Golden State Warriors beat the Orlando Magic 120-97 on December 22, 2025, at...
By Mica