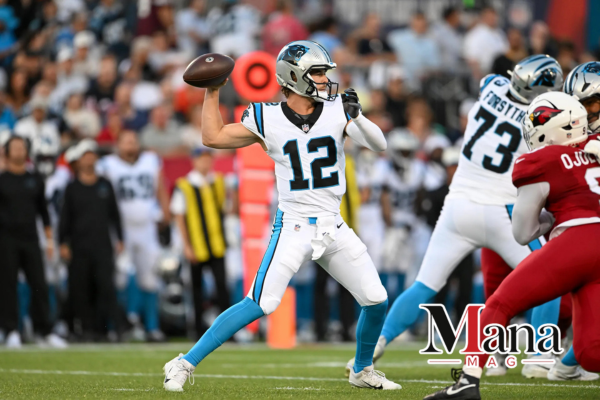
The Carolina Panthers vs New England Patriots match player stats from September 28, 2025, show how New England turned a close opening quarter into a 42-13 victory at Gillette Stadium. The Patriots scored 21 points in the second quarter and never gave Carolina a chance to recover.
Drake Maye delivered one of the best individual performances of the afternoon, completing 14 of 17 passes for 203 yards and two touchdowns without an interception. Stefon Diggs led all receivers with 101 yards, while Marcus Jones provided a huge special teams play with an 87-yard punt return touchdown.
Carolina actually finished with more total yards, more first downs, more offensive plays, and more time of possession. That makes the final score more interesting. New England won because the Patriots produced more points from their possessions, finished perfectly in the red zone, and generated explosive plays at key moments.
Carolina Panthers vs New England Patriots Match Summary
The game took place on September 28, 2025, at Gillette Stadium in Foxborough, Massachusetts.
New England entered Week 4 at 1-2. Carolina also entered at 1-2 after beating Atlanta in Week 3. The Patriots moved to 2-2 with the 42-13 win, while the Panthers fell to 1-3.
Final Score by Quarter
| Quarter | Carolina Panthers | New England Patriots |
| 1st | 6 | 7 |
| 2nd | 0 | 21 |
| 3rd | 0 | 7 |
| 4th | 7 | 7 |
| Final | 13 | 42 |
Carolina opened the scoring with a touchdown pass from Bryce Young to Tommy Tremble, but the extra point was missed.
New England answered with an 87-yard punt return by Marcus Jones.
The second quarter changed the game. Drake Maye, TreVeyon Henderson, and Antonio Gibson each scored rushing touchdowns, giving the Patriots a 28-6 halftime lead.
New England added another touchdown in the third quarter and one more in the fourth.
Carolina scored its final touchdown late in the fourth quarter when Andy Dalton connected with Mitchell Evans.
Carolina Panthers vs New England Patriots Team Stats
The team statistics create an interesting picture because Carolina won several volume categories despite losing by 29 points.
| Statistic | Panthers | Patriots |
| Total Yards | 326 | 307 |
| First Downs | 21 | 16 |
| Offensive Plays | 65 | 48 |
| Yards per Play | 5.0 | 6.4 |
| Rushing Yards | 129 | 104 |
| Passing Yards | 197 | 203 |
| Third Down | 5/14 | 3/9 |
| Fourth Down | 1/3 | 1/1 |
| Red Zone | 2/2 | 4/4 |
| Turnovers Lost | 0 | 0 |
| Time of Possession | 35:14 | 24:46 |
| Touchdowns | 2 | 6 |
Carolina ran 65 offensive plays compared with only 48 for New England.
The Panthers also held the ball for more than 35 minutes.
Yet the Patriots scored 42 points.
The difference was efficiency. New England averaged 6.4 yards per offensive play, compared with 5.0 for Carolina. The Patriots also scored touchdowns on all four red-zone trips.
Quarterback Stats
Bryce Young
Bryce Young completed 18 of 30 passes for 150 yards and one touchdown.
His complete passing line was:
| Statistic | Bryce Young |
| Completions | 18 |
| Attempts | 30 |
| Passing Yards | 150 |
| Completion Rate | 60% |
| Passing TDs | 1 |
| Interceptions | 0 |
| Sacks | 1 |
| Sack Yards | 11 |
| Passer Rating | 84.0 |
Young averaged only 5.0 yards per attempt.
He avoided interceptions, but Carolina struggled to create enough explosive passing plays to keep pace with New England.
Young also rushed once for three yards.
Andy Dalton
Andy Dalton entered the game later and produced an efficient passing line.
He completed five of six attempts for 58 yards and one touchdown.
His passer rating was 146.5.
Dalton connected with Mitchell Evans for Carolina’s final touchdown.
His limited sample was much more efficient than Young’s, but the game was already out of reach when he entered.
Drake Maye
Drake Maye was the standout quarterback.
He completed 14 of 17 passes for 203 yards and two touchdowns.
| Statistic | Drake Maye |
| Completions | 14 |
| Attempts | 17 |
| Completion Rate | 82.4% |
| Passing Yards | 203 |
| Passing TDs | 2 |
| Interceptions | 0 |
| Sacks | 1 |
| Sack Yards | 0 |
| Passer Rating | 155.6 |
Maye averaged 11.9 yards per completion attempt and produced a 155.6 passer rating.
He also rushed three times for 11 yards and scored a touchdown.
That gave him three total touchdowns.
Carolina Panthers Rushing Stats
Carolina ran the ball 28 times for 129 yards, averaging 4.6 yards per carry.
Chuba Hubbard
Chuba Hubbard led the Panthers with 49 rushing yards.
He carried the ball 10 times and averaged 4.9 yards per attempt.
Hubbard also caught three passes for 20 yards.
Trevor Etienne
Trevor Etienne rushed seven times for 33 yards.
His longest run went for 22 yards.
He averaged 4.7 yards per carry.
Rico Dowdle
Rico Dowdle recorded nine carries for 32 yards.
He averaged 3.6 yards per carry.
Dowdle also caught one pass, although the reception lost two yards.
Carolina Rushing Table
| Player | Carries | Yards | Average | Long | TD |
| Chuba Hubbard | 10 | 49 | 4.9 | 11 | 0 |
| Trevor Etienne | 7 | 33 | 4.7 | 22 | 0 |
| Rico Dowdle | 9 | 32 | 3.6 | 10 | 0 |
| David Moore | 1 | 12 | 12.0 | 12 | 0 |
| Bryce Young | 1 | 3 | 3.0 | 3 | 0 |
| Total | 28 | 129 | 4.6 | 22 | 0 |
New England Patriots Rushing Stats
New England ran 29 times for 104 yards.
The Patriots averaged 3.6 yards per carry but scored three rushing touchdowns.
Rhamondre Stevenson
Stevenson led New England with 38 rushing yards on nine carries.
His longest run covered 22 yards.
He did not score a touchdown.
TreVeyon Henderson
Henderson carried seven times for 32 yards.
He averaged 4.6 yards per carry and scored one touchdown.
Antonio Gibson
Gibson rushed six times for 27 yards and scored one touchdown.
His longest run covered 21 yards.
Drake Maye
Maye added 11 rushing yards and scored another touchdown on the ground.
The Patriots therefore had three different rushing touchdown scorers, with Maye, Henderson, and Gibson each finding the end zone.
New England Rushing Table
| Player | Carries | Yards | Average | Long | TD |
| Rhamondre Stevenson | 9 | 38 | 4.2 | 22 | 0 |
| TreVeyon Henderson | 7 | 32 | 4.6 | 11 | 1 |
| Antonio Gibson | 6 | 27 | 4.5 | 21 | 1 |
| Drake Maye | 3 | 11 | 3.7 | 5 | 1 |
| Josh Dobbs | 3 | -2 | -0.7 | 0 | 0 |
| Kayshon Williams | 1 | -2 | -2.0 | -2 | 0 |
| Total | 29 | 104 | 3.6 | 22 | 3 |
Carolina Panthers Receiving Stats
Carolina had 23 completed passes for 208 gross passing yards.
Tetairoa McMillan
Tetairoa McMillan led Carolina in receiving yards.
He caught four passes for 62 yards.
His longest reception went for 22 yards.
He averaged 15.5 yards per catch.
Tommy Tremble
Tommy Tremble caught five passes for 42 yards.
He also scored Carolina’s opening touchdown.
His five receptions were the most by any Panthers receiver.
Brycen Tremayne
Brycen Tremayne caught three passes for 36 yards.
His longest reception covered 24 yards.
Mitchell Evans
Mitchell Evans caught three passes for 23 yards and scored a touchdown late in the fourth quarter.
Carolina Receiving Table
| Player | Targets | Receptions | Yards | Average | Long | TD |
| Tommy Tremble | 8 | 5 | 42 | 8.4 | 15 | 1 |
| Tetairoa McMillan | 8 | 4 | 62 | 15.5 | 22 | 0 |
| Brycen Tremayne | 4 | 3 | 36 | 12.0 | 24 | 0 |
| Mitchell Evans | 4 | 3 | 23 | 7.7 | 16 | 1 |
| Chuba Hubbard | 3 | 3 | 20 | 6.7 | 14 | 0 |
| Jalen Mitchell | 2 | 2 | 17 | 8.5 | 9 | 0 |
| Hunter Renfrow | 2 | 2 | 10 | 5.0 | 5 | 0 |
| Rico Dowdle | 1 | 1 | -2 | -2.0 | -2 | 0 |
New England Patriots Receiving Stats
The Patriots completed 14 passes for 203 yards.
Stefon Diggs
Stefon Diggs was the leading receiver in the game.
He caught six passes for 101 yards.
His longest reception went 33 yards.
Diggs averaged 16.8 yards per catch.
His production helped New England create explosive passing plays without needing a large number of attempts.
Hunter Henry
Hunter Henry caught two passes for 39 yards.
He scored on a 31-yard touchdown reception in the third quarter.
That was the Patriots’ first touchdown of the second half.
Austin Hooper
Hooper caught one pass for 24 yards.
Kayshon Boutte
Boutte recorded one reception for 18 yards.
Mack Hollins
Hollins caught one pass for four yards and scored a touchdown.
New England Receiving Table
| Player | Targets | Receptions | Yards | Average | Long | TD |
| Stefon Diggs | 7 | 6 | 101 | 16.8 | 33 | 0 |
| Hunter Henry | 2 | 2 | 39 | 19.5 | 31 | 1 |
| Austin Hooper | 1 | 1 | 24 | 24.0 | 24 | 0 |
| Kayshon Boutte | 3 | 1 | 18 | 18.0 | 18 | 0 |
| TreVeyon Henderson | 2 | 2 | 14 | 7.0 | 9 | 0 |
| Mack Hollins | 1 | 1 | 4 | 4.0 | 4 | 1 |
| Rhamondre Stevenson | 1 | 1 | 3 | 3.0 | 3 | 0 |
Marcus Jones Changes the Game
Marcus Jones produced one of the most important plays in the Carolina Panthers vs New England Patriots matchup.
He returned a punt 87 yards for a touchdown in the first quarter.
Jones finished with three punt returns for 167 yards.
That gave him an average of 55.7 yards per return.
The touchdown came after Carolina had taken a 6-0 lead.
Instead of allowing the Panthers to control the early momentum, New England immediately answered with seven points.
Special teams therefore contributed a full touchdown to the Patriots’ final total.
The Patriots’ Red-Zone Efficiency
Red-zone execution was another major difference.
New England entered the red zone four times and scored four touchdowns.
Carolina also scored touchdowns on both of its red-zone trips.
| Team | Red-Zone Trips | TDs | Success Rate |
| Panthers | 2 | 2 | 100% |
| Patriots | 4 | 4 | 100% |
Both teams were perfect inside the red zone.
The difference was opportunity.
New England reached the red zone four times.
Carolina reached it twice.
That gave the Patriots twice as many chances to convert strong drives into touchdowns.
Why New England Won Despite Fewer Yards
This game provides a useful example of why total yardage does not always predict the winner.
Carolina gained 326 total yards.
New England gained 307.
The Panthers also had 21 first downs compared with 16 for the Patriots.
Carolina held the ball for 35:14.
New England had possession for only 24:46.
Yet New England won by 29 points.
The Patriots Created Bigger Plays
New England averaged 6.4 yards per offensive play.
Carolina averaged 5.0.
The Patriots also averaged 11.3 yards per pass attempt compared with 5.8 for Carolina.
New England Scored Six Touchdowns
The Patriots scored:
- Three rushing touchdowns
- Two passing touchdowns
- One punt-return touchdown
Carolina scored two passing touchdowns and no rushing touchdowns.
New England Needed Fewer Plays
The Patriots ran only 48 offensive plays.
Carolina ran 65.
New England still produced 307 yards.
That means the Patriots gained more from each offensive snap.
Second Quarter Decided the Game
The first quarter ended with New England leading 7-6.
Then the Patriots exploded for 21 points in the second quarter.
Drake Maye’s Rushing Touchdown
Maye scored on a five-yard run after a six-play, 80-yard drive.
TreVeyon Henderson’s Touchdown
Henderson followed with a five-yard rushing touchdown after an eight-play, 55-yard drive.
Antonio Gibson’s Touchdown
Gibson scored from one yard out after a four-play, 14-yard drive.
New England went from a one-point lead to a 28-6 halftime advantage in one quarter.
That 21-point period effectively decided the game.
Third and Fourth Down Comparison
Carolina actually converted more third downs in total.
The Panthers went 5-for-14, or 35.7%.
New England went 3-for-9, or 33.3%.
The difference came on fourth down.
Carolina converted only one of three fourth-down attempts.
New England converted its only fourth-down attempt.
The Patriots also had better results from the red zone, reaching the area four times and scoring four touchdowns.
Turnovers Did Not Decide the Game
Neither team lost a turnover.
Carolina fumbled once but recovered the ball.
New England did not lose a fumble.
Neither team threw an interception.
That makes the result even more interesting.
Many NFL games are decided by turnovers.
This one was decided more by scoring efficiency, explosive plays, and touchdown production.
Time of Possession Was Not Enough for Carolina
Carolina controlled the clock for 35 minutes and 14 seconds.
New England had possession for only 24 minutes and 46 seconds.
The Panthers also ran 17 more offensive plays.
Still, New England scored 42 points.
This shows why possession time needs to be viewed alongside yards per play and scoring efficiency.
Carolina had longer stretches with the ball.
New England did more damage when the Patriots had the ball.
Special Teams Comparison
The punt-return numbers were heavily tilted toward New England.
| Category | Panthers | Patriots |
| Punt Returns | 3 | 3 |
| Punt Return Yards | 19 | 167 |
| Longest Punt Return | 13 | 87 |
| Punt Return TDs | 0 | 1 |
| Kickoff Return Yards | 139 | 48 |
Marcus Jones accounted for 167 punt-return yards by himself.
Carolina managed only 19 total punt-return yards.
That 148-yard difference in punt returns gave New England a strong field-position advantage.
Passing Efficiency Comparison
The quarterback numbers show another major gap.
| Statistic | Bryce Young | Drake Maye |
| Completions | 18 | 14 |
| Attempts | 30 | 17 |
| Completion Rate | 60.0% | 82.4% |
| Passing Yards | 150 | 203 |
| TDs | 1 | 2 |
| INTs | 0 | 0 |
| Passer Rating | 84.0 | 155.6 |
| Yards per Attempt | 5.0 | 11.9 |
Young completed four more passes than Maye.
Maye still threw for 53 more yards.
That came from much greater efficiency.
Maye averaged 11.9 yards per attempt, while Young averaged 5.0.
That difference is one of the clearest reasons the Patriots generated more points despite throwing fewer passes.
Most Important Player Matchups
Drake Maye vs Bryce Young
Maye had the better statistical performance.
He threw for 203 yards, two touchdowns, no interceptions, and posted a 155.6 passer rating.
Young threw for 150 yards, one touchdown, no interceptions, and finished with an 84.0 passer rating.
Maye also added a rushing touchdown.
Stefon Diggs vs Carolina’s Secondary
Diggs finished with 101 yards from six catches.
His 33-yard reception was the longest catch by a Patriots receiver.
He gave Maye a reliable downfield target and helped New England maintain a high yards-per-pass figure.
Chuba Hubbard vs New England’s Run Defense
Hubbard led Carolina with 49 rushing yards.
The Panthers rushed for 129 yards as a team.
The Patriots allowed more rushing yards than Carolina, but New England compensated by scoring three rushing touchdowns and creating more points from its possessions.
Marcus Jones vs Carolina’s Special Teams
Jones delivered the biggest special teams play.
His 87-yard punt return touchdown gave New England seven points and helped shift momentum early.
What the Player Stats Say About Bryce Young
Young’s stat line was mixed.
He completed 60% of his passes and did not throw an interception.
Those numbers are respectable.
The problem was his 5.0 yards per attempt.
Carolina needed 30 Young pass attempts to produce 150 yards.
New England needed only 17 Maye attempts to produce 203 yards.
That efficiency gap made a major difference.
Andy Dalton’s late appearance also produced five completions on six attempts for 58 yards and a touchdown, but those numbers came after the Patriots had built a 42-6 lead.
What the Player Stats Say About Drake Maye
Maye’s performance stands out because of both accuracy and efficiency.
He completed 82.4% of his passes.
He threw two touchdowns without an interception.
He averaged 11.9 yards per attempt.
He also rushed for 11 yards and scored a touchdown.
His 155.6 passer rating was the highest among the quarterbacks in the game.
For a quarterback who attempted only 17 passes, producing 203 yards shows how often New England generated meaningful yardage on individual plays.
The Biggest Positive Takeaways for Carolina
Chuba Hubbard Led the Ground Game
Hubbard produced 49 rushing yards and added 20 receiving yards.
He provided consistent production even though Carolina failed to score a rushing touchdown.
Tetairoa McMillan Had the Most Receiving Yards
McMillan caught four passes for 62 yards.
His 15.5 yards per catch led Carolina’s main receiving group.
Andy Dalton Was Efficient
Dalton completed five of six passes for 58 yards and a touchdown.
His 146.5 passer rating was strong, although he played late in the game.
Carolina Avoided Turnover Problems
The Panthers did not throw an interception.
Their only fumble did not result in a lost possession.
That kept the turnover column clean despite the large defeat.
The Biggest Positive Takeaways for New England
Drake Maye Was Highly Efficient
Maye completed 14 of 17 passes for 203 yards and two touchdowns.
Stefon Diggs Produced a 100-Yard Game
Diggs finished with 101 receiving yards.
He was the only player from either team to reach 100 receiving yards.
The Running Game Scored Three Times
Maye, Henderson, and Gibson each scored rushing touchdowns.
Marcus Jones Added Seven Points
Jones’ 87-yard punt return touchdown was a major turning point in the opening quarter.
A Simple Way to Analyze This Box Score
When looking at Carolina Panthers vs New England Patriots match player stats, do not focus only on total yards.
Check these numbers in order:
- Quarterback efficiency
- Yards per play
- Touchdowns
- Red-zone opportunities
- Explosive plays
- Third and fourth downs
- Turnovers
- Special teams
- Time of possession
This game is a good example.
Carolina had more yards and possession.
New England had more touchdowns.
That difference decided the game.
Final Takeaway
The New England Patriots defeated the Carolina Panthers 42-13 on September 28, 2025, at Gillette Stadium.
Drake Maye was the leading quarterback, completing 14 of 17 passes for 203 yards and two touchdowns without an interception. Stefon Diggs led all receivers with 101 yards. Marcus Jones added an 87-yard punt-return touchdown, while TreVeyon Henderson, Antonio Gibson, and Maye each scored on the ground.
For Carolina, Bryce Young completed 18 of 30 passes for 150 yards and one touchdown. Chuba Hubbard led the rushing attack with 49 yards, while Tetairoa McMillan produced 62 receiving yards.
The unusual part of this game was the team yardage. Carolina finished with 326 total yards compared with New England’s 307.
The Panthers also had more first downs, more offensive plays, and more time of possession.
The Patriots still won comfortably because they produced 42 points from fewer plays. New England averaged 6.4 yards per play, scored touchdowns on all four red-zone trips, and gained 167 punt-return yards.
The second quarter proved decisive. New England scored 21 points during that period and entered halftime with a 28-6 lead.
For anyone searching for Carolina Panthers vs New England Patriots match player stats or New England Patriots vs Carolina Panthers match player stats, the main lesson from this game is clear. Volume statistics can tell you how much a team did. Efficiency statistics often explain why the scoreboard looks so different.
FAQ
Who won the Carolina Panthers vs New England Patriots game?
The New England Patriots defeated the Carolina Panthers 42-13 on September 28, 2025, at Gillette Stadium in Foxborough.
What were Drake Maye’s stats against the Panthers?
Drake Maye completed 14 of 17 passes for 203 yards and two touchdowns without an interception. He also rushed three times for 11 yards and one touchdown.
What were Bryce Young’s stats against the Patriots?
Bryce Young completed 18 of 30 passes for 150 yards and one touchdown with no interceptions. He was sacked once for 11 yards.
Who led the Patriots in receiving?
Stefon Diggs led New England with six receptions for 101 yards. His longest catch covered 33 yards.
Who led the Panthers in receiving?
Tetairoa McMillan led Carolina with 62 receiving yards on four catches. Tommy Tremble had the most receptions with five.
Who led the Panthers in rushing?
Chuba Hubbard led Carolina with 49 rushing yards on 10 carries. He averaged 4.9 yards per carry.
Who scored the Patriots’ rushing touchdowns?
Drake Maye, TreVeyon Henderson, and Antonio Gibson each scored a rushing touchdown.
Who returned a punt for a touchdown?
Marcus Jones returned a punt 87 yards for a touchdown. He finished with 167 punt-return yards on three returns.
Did either team throw an interception?
No. Bryce Young and Drake Maye both finished without an interception. Neither team lost a turnover.
Which team had more total yards?
Carolina had more total yards, 326 to 307. The Panthers also ran 65 offensive plays compared with 48 for New England.
Why did the Patriots win despite having fewer total yards?
New England gained more yards per play, scored six touchdowns compared with Carolina’s two, went 4-for-4 in the red zone, and received a seven-point contribution from Marcus Jones’ punt return.
How many points did the Patriots score in the second quarter?
New England scored 21 points in the second quarter. That turned a 7-6 first-quarter lead into a 28-6 halftime advantage.

Must See
-

Sports
/ 2 months agoLos Angeles Chargers vs Detroit Lions Match Player Stats: 2025 Hall of Fame Game
The Los Angeles Chargers defeated the Detroit Lions 34-7 in the 2025 NFL Hall...
By Mica -


Sports
/ 2 months agoPittsburgh Pirates vs Mets Match Player Stats: August 2026 Game Breakdown
The Pittsburgh Pirates and New York Mets produced two very different games during their...
By Mica -


Sports
/ 2 months agoGolden State Warriors vs Orlando Magic Match Player Stats, Box Score and Game Analysis
The Golden State Warriors beat the Orlando Magic 120-97 on December 22, 2025, at...
By Mica